The map confirms empirically what is already known anecdotally: That murders in the city are overwhelmingly concentrated in the majority black-and-poor neighborhoods of North St. Louis. That's not an opinion; that's a fact, and a very troubling one that demands more attention.
Of course, Eddie Roth, who recently replaced Sam Dotson as City Hall's director of operations, had quite a different take on NextSTL's map. His point was, in effect: Look on the bright side!
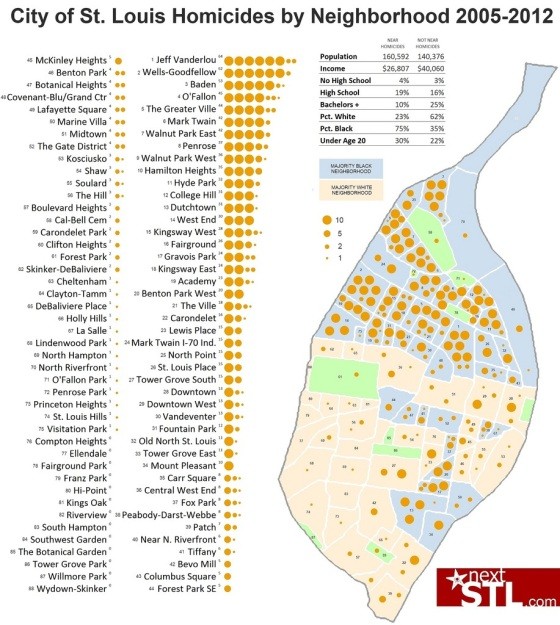
In the comments section, Roth wrote that many would be surprised to see "how much of the city has an exceedingly low homicide rate."
The rates overall, Roth says, are "damnable," "tragic" and "unacceptably high," but he adds that:
St. Louisans should take heart in knowing, as nextSTL's map reveals, that city neighborhood upon city neighborhood are and always have been safe, that broad measures of violent and property crime show a city that has experienced indisputably steady and dramatic reductions in crime in recent years, and that St. Louis has the potential, and I believe is poised, to experience breakthrough reductions of crime.
(I hope that's true, and not just bluster from City Hall three months before an election.)
Roth said it's crime-mapping like this that enables hot-spot policing, which has shown some success in the city. Crime maps also shape perceptions, according to Roth:
What, for example, would nextSTL's map and homicide rates look like if displayed homicides were limited to (or excluded) those occurring during late night (or work day or early evening) hours? How would the array and rates appear if they were limited to (or excluded) homicides known to be the product of gang violence, or family or intimate partner violence, or in which there is direct evidence of drug use among all known participants, or in which all known participants had prior criminal convictions, or exclusively involved men between the ages of 18 and 25.Well good. Those are all maps I would look forward to seeing, as they would surely stir up some helpful discussion, as Ihnen's map has already done.
How might such dynamic mapping affect the public's perception of safety and well being and help it organize its own conduct to reduce risks of criminal victimization? How might it inform and affect policy makers' and police and other public safety strategic and tactical approach to law enforcement and crime prevention?
This too is work being undertaken by St. Louis' Public Safety Partnership.